LLM Observability in 2026: The Complete Enterprise Guide
LLM observability has become the operational backbone of enterprise AI. This guide explains what it is, why traditional APM falls short, the four signals every team must track, and how to build an observability stack that survives production traffic.
In 2026, large language models sit in the critical path of nearly every enterprise workflow. They generate customer responses, write code, summarize legal documents, route support tickets, draft financial analyses, trigger backend tool calls, and orchestrate multi-agent operations across cloud platforms. Yet most enterprises monitor these systems with the same tools they used for stateless microservices five years ago — and the gap is showing up as outages, runaway costs, regulatory exposure, and security incidents that nobody saw coming.
LLM observability is the discipline that closes that gap. It is the practice of instrumenting language-model-powered systems so engineers can answer four questions at any moment: what did the model do, why did it do it, what did it cost, and was it safe? This guide walks through the modern observability stack — what to instrument, which signals to prioritize, how to wire it into your incident response process, and the patterns that consistently work at enterprise scale.
Why traditional APM is not enough
Application performance monitoring tools were built for deterministic systems where the same input produces the same output. LLMs are non-deterministic, stateful across multi-turn conversations, and increasingly call external tools that produce side effects. An APM dashboard can tell you that a request took 4.2 seconds and returned a 200, but it cannot tell you that the model fabricated a customer ID, that the embedded prompt injection rewrote the system instruction, or that token spend on a single workflow tripled overnight after a prompt change. LLM observability fills those blind spots with prompt-aware tracing, evaluation pipelines, cost attribution, and safety telemetry.
The four signals of LLM observability
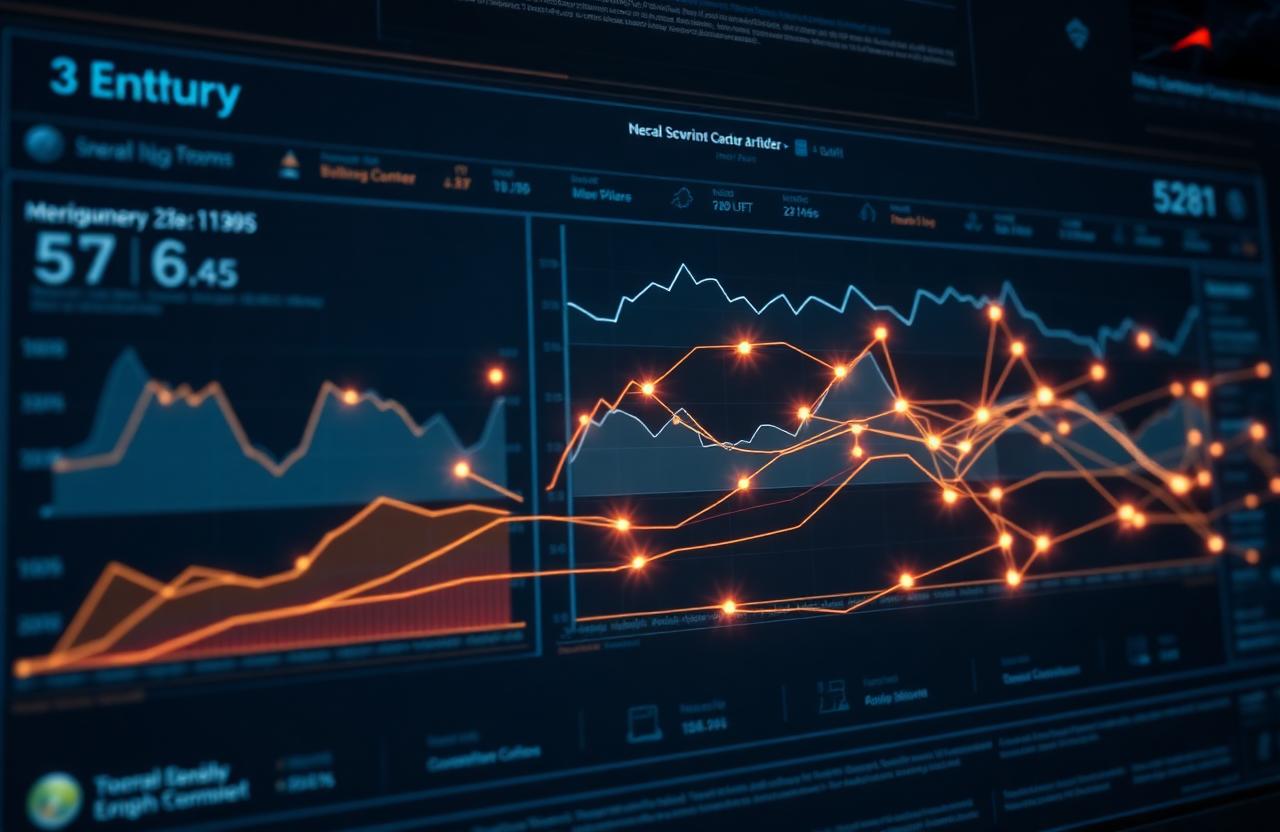
Every production-grade observability stack we have helped enterprises build instruments four signal families. Traces capture the full decision chain — system prompt, user input, retrieved context, model output, tool calls, and downstream responses — as nested spans with full payload visibility. Evaluations score every output (or a sampled slice) on quality, faithfulness, relevance, toxicity, and task success, using a mix of programmatic checks and LLM-as-judge graders. Cost telemetry attributes token spend to workflow, customer, and model version so finance can forecast and engineering can optimize. Safety telemetry tracks injection attempts, hallucination indicators, policy violations, and PII exposure events in real time.
Tracing: the foundation
If you only instrument one thing in 2026, instrument traces. A trace is a tree of spans representing a single user-facing request: the inbound HTTP call, the prompt construction, retrieval augmentation (RAG) queries, vector search results, each LLM call with its full prompt and completion, every tool invocation, and the final response. OpenTelemetry's GenAI semantic conventions standardize span attributes — gen_ai.system, gen_ai.request.model, gen_ai.usage.input_tokens, gen_ai.usage.output_tokens, gen_ai.response.finish_reasons — so traces from OpenAI, Anthropic, Google, and self-hosted models all show up coherently in the same dashboard. Without traces, every incident becomes archaeology. With traces, root cause is usually one click away.
Evaluations: from offline batches to streaming
Most teams start with offline evaluation — a fixed test set, run weekly, compared against a baseline. That is fine for catching regressions before deploy, but it misses the failures that only show up in real traffic: a customer phrasing a question your test set never anticipated, a retrieved document that contains a hostile instruction, a tool that started returning a slightly different schema. Streaming evaluation runs lightweight graders on every (or sampled) production response and emits scores as observability signals. The best stacks combine fast deterministic checks (schema validation, citation presence, refusal patterns) with slower LLM-as-judge graders that score faithfulness and helpfulness on a representative sample. The result: quality regressions surface in minutes, not at the end of the sprint.
Cost: the silent budget killer
Token economics are brutal. A single agent loop that retries on a transient error can consume thousands of input tokens; a poorly-tuned chain-of-thought prompt can quietly triple per-request cost. Without cost attribution, finance finds out at month-end. With cost attribution, engineering can set per-workflow budgets, alert on anomalies, route low-priority traffic to cheaper models, and quantify the savings from prompt compression, caching, and model distillation. Tag every span with workflow, customer, and model version, and the dashboards write themselves.
Safety telemetry: the governance layer
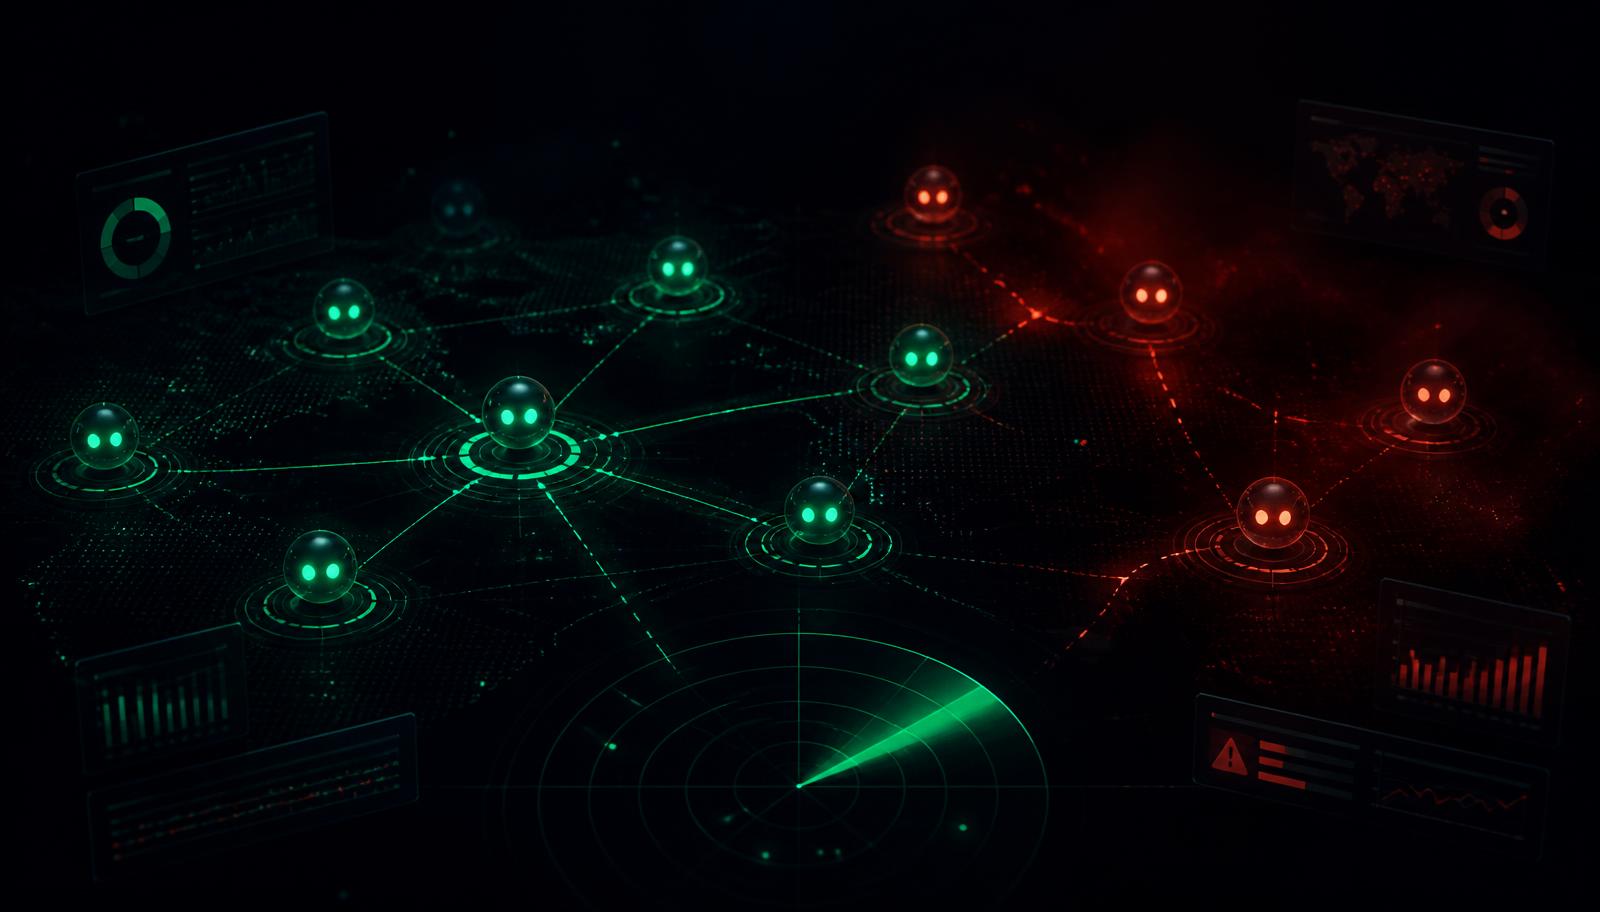
Safety telemetry is what turns observability into governance. Every prompt is scanned for injection patterns, every retrieved document is labeled with provenance, every tool call is evaluated against policy, every output is checked for PII, toxicity, and hallucination indicators. The signals feed back into traces as span attributes (gen_ai.safety.injection_score, gen_ai.safety.policy_decision) so a single dashboard can answer regulator and CISO questions in the same view. This is the layer that converts SOC 2, HIPAA, GDPR, and EU AI Act controls from policy documents into enforceable runtime checks.
Building the stack: vendors vs. open source
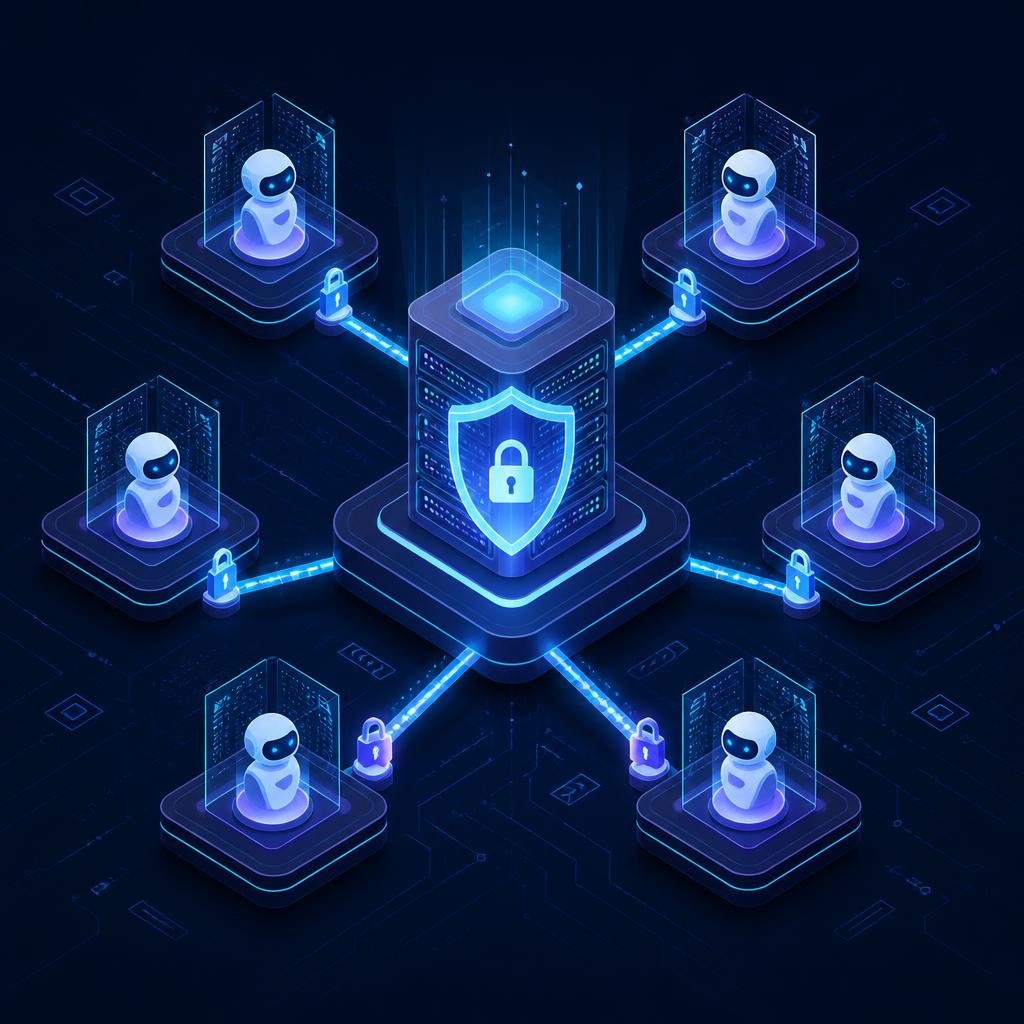
There are now three categories of LLM observability tooling. Open-source frameworks (OpenTelemetry GenAI, OpenLLMetry, Langfuse, Phoenix) provide the instrumentation primitives and let you own the data. Specialist commercial platforms (Arize, Datadog LLM Observability, New Relic AI Monitoring, Helicone) add managed pipelines, prebuilt evaluators, and integrations with existing APM. Governance-grade platforms (Watch Tower Agents) combine observability with runtime policy enforcement, capability segmentation, and compliance evidence collection — the layer that turns telemetry into control. Most enterprises end up combining at least two: an instrumentation layer they own, plus a managed layer that handles retention, evaluation orchestration, and incident workflows.
Production patterns that work
After dozens of enterprise rollouts, the same patterns keep appearing in stacks that hold. Instrument once, at the gateway — wrap your LLM client in a span-emitting middleware so every team gets traces for free. Sample aggressively for cost, but always capture full payloads for errors and safety violations. Run streaming graders in parallel with the main request path so eval latency never blocks user response. Treat prompt versions as deployable artifacts — tag every span with prompt_id and prompt_version so you can A/B and roll back. Wire safety telemetry into your existing SIEM so the SOC sees injection attempts alongside conventional security events.
Common pitfalls
The fastest way to wreck an observability rollout is to log full prompts and completions without a redaction pipeline — you create a new PII liability the day you turn it on. The second-fastest is to skip evaluation entirely and rely on dashboards alone; you will have beautiful charts of a system silently drifting toward failure. The third is treating cost as a finance problem; without engineering ownership, runaway spend always wins. And the fourth is buying a single all-in-one platform without an exit strategy — your traces are your audit trail, and you do not want them locked in a vendor's proprietary format the day the regulator calls.
How LLM observability connects to governance
Observability without governance is reporting; governance without observability is wishful thinking. The two have converged in 2026 because regulators now require both — provable runtime controls and the telemetry to prove the controls fired. Watch Tower Agents was built around this convergence: every policy decision is a span attribute, every blocked tool call generates compliance evidence, every safety violation is correlated back to the trace, prompt, and retrieved context that produced it. The same trace that lets an SRE debug a slow response lets a compliance officer prove HIPAA controls held through an incident.
What to build first
If you are starting from zero, build in this order. Week one: wrap your LLM client and start emitting traces with OpenTelemetry semantic conventions. Week two: add token-usage attribution by workflow and customer. Week three: add a streaming injection detector and a deterministic schema validator on tool calls. Week four: add an LLM-as-judge faithfulness grader on a sampled slice of production traffic. By the end of the first month you will have more visibility than 80 percent of enterprises in production today — and a foundation you can layer policy, governance, and incident response on.
The bottom line
Enterprises that treat LLM observability as optional in 2026 are running production AI blind. The cost of instrumentation is small; the cost of an incident in a system you cannot see is enormous. Whether you build on open source, buy a managed platform, or adopt a governance-grade layer like Watch Tower Agents, the principle is the same: instrument every call, evaluate every output, attribute every dollar, and detect every safety event in real time. Observability is the prerequisite for everything else — performance, cost control, security, and compliance.
Frequently asked questions
What is LLM observability?
LLM observability is the practice of instrumenting language-model-powered systems with traces, evaluations, cost telemetry, and safety signals so teams can answer in real time what the model did, why it did it, what it cost, and whether it was safe.
How is LLM observability different from APM?
APM tracks latency, errors, and throughput of deterministic services. LLM observability adds prompt-aware tracing, output evaluation, token-cost attribution, and safety telemetry — signals that APM tools were never designed to capture.
What are the four signals of LLM observability?
Traces (full per-request decision chains), evaluations (quality and safety scoring of outputs), cost (token spend attributed to workflow and customer), and safety (injection, hallucination, policy violation, and PII telemetry).
Do I need an LLM observability platform if I already use Datadog or New Relic?
You need either GenAI extensions in your existing APM or a specialist platform alongside it. Standard APM cannot capture prompts, completions, evaluation scores, or safety signals — those require LLM-aware instrumentation.
Is OpenTelemetry production-ready for LLMs?
Yes. The OpenTelemetry GenAI semantic conventions are stable enough for production in 2026 and are supported by every major vendor. They are the recommended foundation if you want portable, vendor-neutral traces.
How does observability support compliance?
Traces, evaluation scores, and safety signals are the evidence compliance teams use to prove SOC 2, HIPAA, GDPR, ISO 27001, and EU AI Act controls operated as designed. Without observability, compliance is documentation; with it, compliance is provable.
Govern your agents before they ship
See WatchTower running on your stack in a 30-minute walkthrough.
Keep reading