AI Agent Monitoring for Beginners: Everything You Need to Know
A plain-English beginner's guide to AI agent monitoring — what it is, why it matters, the key metrics to track, the tools to know, and a step-by-step starter plan to keep your AI agents safe, reliable, and performing at their best.
AI agents are no longer science projects. They answer customer emails, draft code, route support tickets, query databases, place orders, and orchestrate multi-step workflows across your business — often with little human oversight. That autonomy is exactly what makes them powerful, and exactly what makes monitoring essential. If you cannot see what an agent is doing in real time, you cannot trust it, you cannot debug it, and you certainly cannot prove to a customer or regulator that it behaved responsibly.
This beginner's guide explains AI agent monitoring from the ground up. No jargon, no assumptions. By the end you will understand what to monitor, why each signal matters, which tools the industry uses, and how to set up a simple monitoring stack that scales as your agent fleet grows.
What is AI agent monitoring?
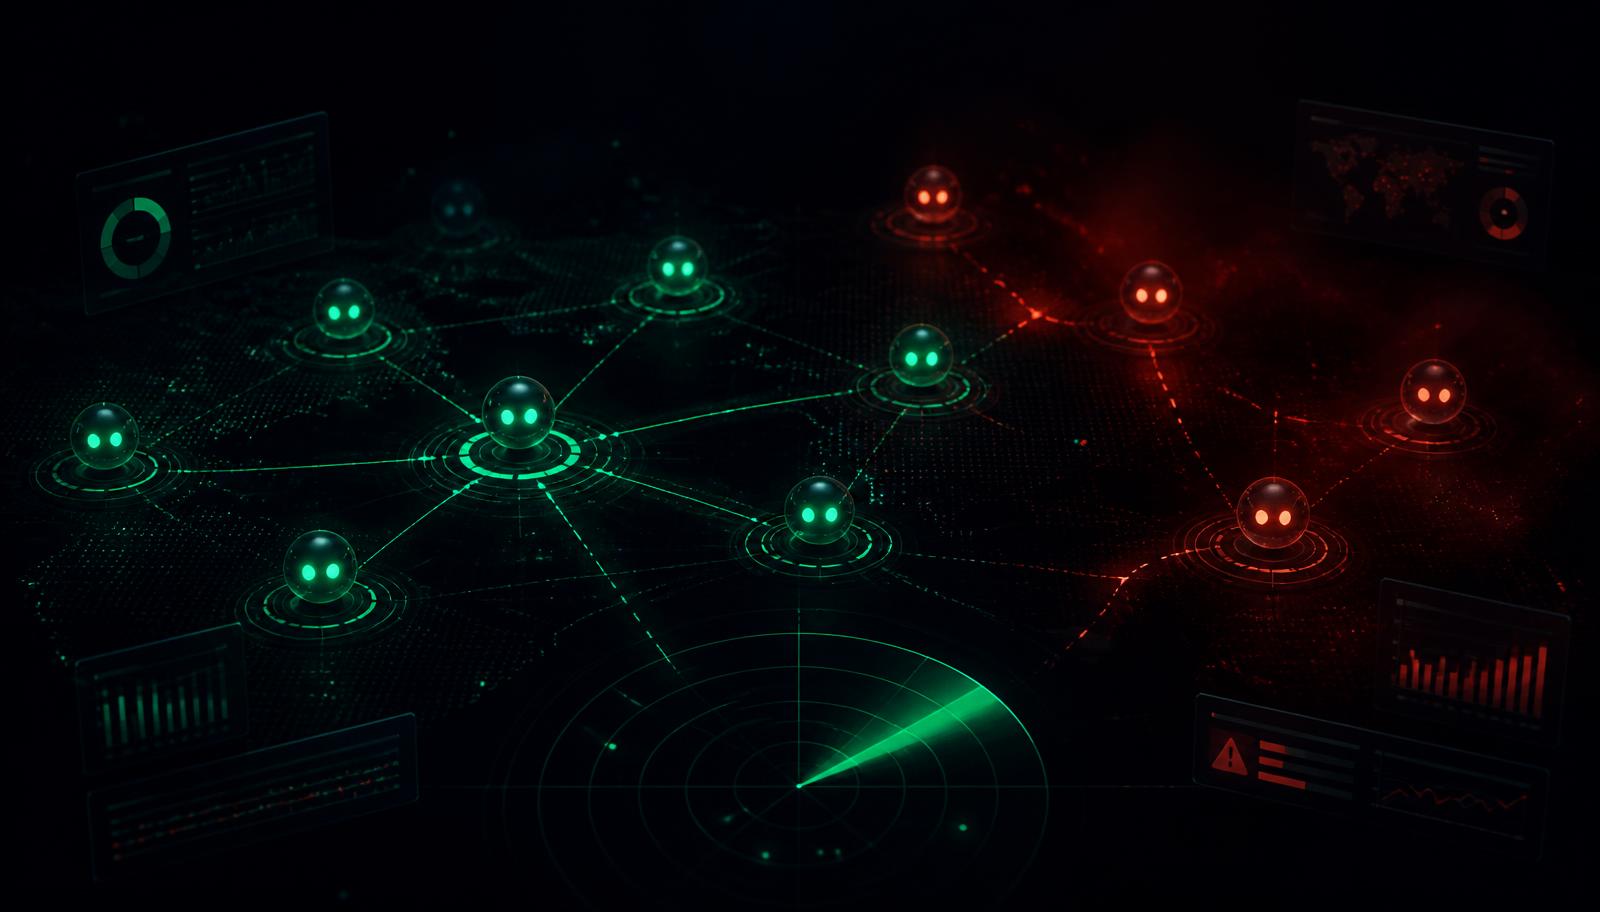
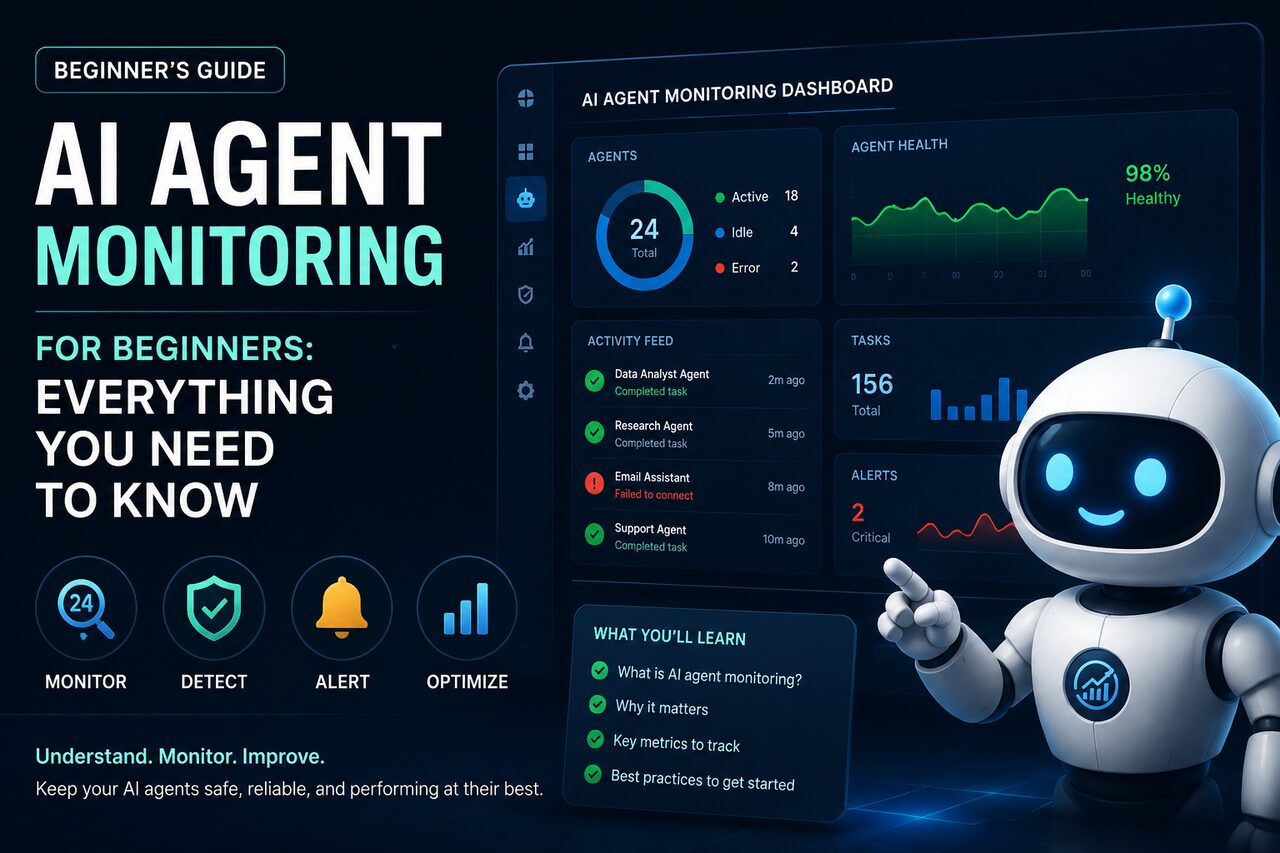
AI agent monitoring is the practice of continuously observing the behavior, performance, cost, and safety of autonomous AI systems in production. Think of it like the dashboard in a car: speed, fuel, engine temperature, warning lights. For an AI agent, the equivalent signals are task success rate, latency, token cost, tool-call accuracy, and safety events such as prompt injection attempts or hallucinated outputs. Monitoring captures all of this in real time so engineers, product owners, and compliance teams can answer one question at any moment: is my agent doing what it should, the way it should?
Why AI agent monitoring matters
Traditional software is deterministic — the same input produces the same output every time. AI agents are not. They make probabilistic decisions, call external tools that change the world (sending emails, charging credit cards, updating records), and can be manipulated by hostile inputs hidden in user messages or retrieved documents. Without monitoring, a single bad prompt update can quietly triple your token bill overnight, a prompt injection attack can exfiltrate customer data, and a hallucinated tool call can cancel the wrong order. With monitoring, you see those failures the moment they happen — often before a customer does.
The three pillars: logs, traces, and evaluations
Every good monitoring setup is built on three pillars. Logs are the raw record of what happened — every prompt, every response, every tool call, time-stamped and searchable. Traces connect those logs into a story: when a user asked a question, the agent did this, then that, then called this tool, then returned that answer. A trace lets you replay an entire decision chain in one view. Evaluations are the quality layer — they score whether the agent's output was actually correct, helpful, faithful to source documents, and free of policy violations. Logs tell you what happened. Traces tell you why. Evaluations tell you whether it was good. You need all three.
The five core metrics every beginner should track
Start simple. The five metric families below give you a complete picture of agent health without overwhelming a new team. Health and uptime: is the agent online, responding, and within its normal error rate? Task success rate: of the requests the agent received, how many completed successfully? Latency and cost: how long did each task take, and how many tokens did it consume? Tool-call accuracy: when the agent called an external API, database, or function, did it use the right tool with the right arguments? Safety signals: how many prompt-injection attempts, hallucinations, PII leaks, or policy violations occurred? Get these five right and you are ahead of most production deployments today.
Health and uptime
This is the baseline. Is your agent reachable, responding within an acceptable time window, and returning valid responses? Track error rates by type — model API failures, tool timeouts, validation errors — and set alerts on anomalous spikes. A sudden surge in 429 rate-limit errors from your model provider means you need to back off or upgrade your tier. A spike in tool timeouts usually points to a downstream service problem, not the agent itself. These are the easiest metrics to capture and the most important to keep green.
Task success rate
Health tells you the agent is alive. Success rate tells you it is useful. Define what success means for each agent workflow — a closed support ticket, a confirmed order, a delivered email, a passing code review — and instrument it. Many teams start with a simple binary success flag emitted at the end of each task. Over time you can layer richer signals: partial success, escalation to a human, retry counts, and user-reported corrections. A drop in success rate is almost always the first sign that something has changed — a prompt update, a model version bump, an upstream API drift, or a new category of user request the agent was never designed for.
Latency and cost per task
Every agent task has two budgets: time and tokens. Latency matters because users notice. Cost matters because token spend on a busy agent can compound quickly — a single workflow that retries on transient errors can consume thousands of input tokens per attempt. Tag every trace with the workflow, customer, and model version, then build dashboards that show p50 and p95 latency, total tokens, and dollar cost per workflow. The first time you see a single workflow consuming 60 percent of your monthly bill, you will understand why this metric is non-negotiable.
Tool-call accuracy
Modern agents are powerful because they can call tools — APIs, databases, internal services, payment processors. They are dangerous for the same reason. Tool-call accuracy tracks whether the agent picked the right tool, supplied the right arguments, respected the right permissions, and handled the response correctly. A simple deterministic schema validator on every tool call catches most failures cheaply. Add policy-as-code checks that block forbidden combinations — for example, an agent calling refund_order on an account it does not own — and you have prevented entire categories of incidents before they happen.
Safety signals
Safety is the metric family most beginners skip and most regret skipping. At minimum, scan every inbound prompt for known injection patterns, every outbound response for PII leaks and policy violations, and every retrieved document for embedded instructions that try to hijack the agent's behavior. Track these as first-class metrics — injection attempts per hour, blocked outputs per day, hallucination indicators by workflow. These are also the signals your security team, your compliance auditor, and your legal team will ask for first. Capture them from day one.
How AI agent monitoring actually works
Under the hood, monitoring works by wrapping every agent interaction in instrumentation. When your agent receives a request, a small piece of middleware opens a trace. Every model call, tool call, retrieval, and response is recorded as a span inside that trace, with attributes like model name, token counts, latency, and outcome. The trace is exported to an observability backend — your own database, an open-source platform like Langfuse or Phoenix, a commercial platform like Datadog or Arize, or a governance-grade platform like Watch Tower Agents. Dashboards and alerts read from that backend and surface anomalies in real time.
Tools and platforms to know
The AI agent monitoring landscape in 2026 has three layers. Open-source instrumentation includes OpenTelemetry GenAI conventions, OpenLLMetry, Langfuse, and Phoenix — these let you own your data and integrate with anything. Commercial observability platforms like Datadog LLM Observability, New Relic AI Monitoring, Arize, and Helicone add managed pipelines, prebuilt evaluators, and integration with your existing APM. Governance-grade platforms like Watch Tower Agents combine monitoring with runtime policy enforcement, capability segmentation, and compliance evidence collection — useful when you need to prove controls operated as designed, not just observe them. Most mature setups combine an instrumentation layer they own with a managed layer for retention, evaluation, and incident workflow.
A simple step-by-step starter plan
If you have zero monitoring today, do this in order. Week one: wrap your model client in a middleware that emits OpenTelemetry GenAI spans for every call. You will immediately see prompts, completions, latency, and token usage in your trace backend. Week two: add tags for workflow, customer, and model version, then build a cost-per-workflow dashboard. Week three: add a deterministic schema validator on every tool call and a basic prompt-injection detector on every inbound message. Week four: add a lightweight LLM-as-judge evaluator on a sampled slice of outputs to score faithfulness and task success. By the end of the month you have traces, cost attribution, tool safety, and quality evaluation — more visibility than most enterprises currently run.
Common beginner mistakes
A few traps catch nearly every team. Logging full prompts and responses without a redaction pipeline creates a new PII liability the day you turn it on. Skipping evaluation and relying on dashboards alone produces beautiful charts of a system silently degrading. Treating cost as a finance problem instead of an engineering responsibility lets runaway spend win every time. Buying a closed all-in-one platform with no export path locks your audit trail in someone else's database — exactly where you do not want it when a regulator calls. Start with open standards (OpenTelemetry), own your trace data, and layer commercial tools on top only when they earn their place.
Monitoring vs. observability vs. governance
These terms are often used interchangeably, but they are not the same. Monitoring is the act of watching predefined signals (health, latency, cost) and alerting on anomalies. Observability is the broader discipline of instrumenting systems so you can answer questions you did not anticipate — debugging a strange behavior by exploring traces, evaluations, and metadata. Governance is the policy layer on top: enforcing what agents are allowed to do, proving controls fired, and producing the audit evidence regulators require. Monitoring is the foundation. Observability is the toolkit. Governance is the outcome.
How monitoring supports compliance
Frameworks like SOC 2, HIPAA, GDPR, ISO 27001, and the EU AI Act all require evidence that controls operated as designed. Traces, evaluation scores, and safety signals are exactly that evidence. A trace showing that an agent attempted to access a forbidden record and was blocked by policy is the kind of artifact auditors love. The same telemetry that helps an engineer debug a slow response helps a compliance officer prove HIPAA controls held through an incident. If compliance is in your future — and for most enterprises it is — start monitoring early and tag your spans with the control IDs they prove.
Where Watch Tower Agents fits
Watch Tower Agents is a governance-grade AI agent monitoring and control platform. It captures intent-first traces of every agent action, enforces policy-as-code against tool calls in real time, detects prompt injection and hallucination, segments agent identities with least privilege, and produces ready-made compliance evidence for SOC 2, HIPAA, GDPR, and ISO 27001. For teams that want monitoring and governance in one place — without stitching together five tools — it is purpose-built for the autonomous-agent era.
The bottom line
AI agent monitoring is not optional in 2026. The cost of instrumentation is small; the cost of a silent failure in a system you cannot see is enormous. Start with the five core metrics, build on the three pillars of logs, traces, and evaluations, and grow your stack as your agent fleet grows. Whether you assemble open-source pieces, buy a commercial platform, or adopt a governance-grade layer like Watch Tower Agents, the principle is the same: observe everything, evaluate continuously, and never run an agent in production you cannot see.
Frequently asked questions
What is AI agent monitoring in simple terms?
AI agent monitoring is continuously watching what your AI agents are doing, how well they are doing it, what it costs, and whether they are behaving safely. It is the operational dashboard for autonomous AI — like the gauges in a car, but for software that makes decisions on its own.
Why do I need to monitor AI agents if they already work?
Because AI agents are non-deterministic and can drift, fail, or be manipulated without warning. A prompt update can triple your costs overnight, a prompt injection can leak data, and a hallucinated tool call can take real-world actions you never intended. Monitoring is how you catch these issues before customers or regulators do.
What are the most important metrics for a beginner to track?
Five: health and uptime, task success rate, latency and cost per task, tool-call accuracy, and safety signals like prompt injection or hallucination rates. Get these five right and you have a stronger baseline than most production AI deployments.
What is the difference between monitoring and observability?
Monitoring watches predefined signals and alerts on anomalies. Observability is the broader practice of instrumenting your system with rich traces and metadata so you can investigate problems you did not anticipate. Monitoring tells you something broke; observability helps you figure out why.
Do I need an expensive platform to monitor AI agents?
No. You can start with OpenTelemetry GenAI conventions and an open-source backend like Langfuse or Phoenix and capture more than most teams have today. Commercial and governance-grade platforms like Watch Tower Agents add value when you need real-time policy enforcement, compliance evidence, or managed evaluation at scale.
How does AI agent monitoring help with compliance?
Traces, evaluation scores, and safety telemetry are the evidence auditors need to prove SOC 2, HIPAA, GDPR, ISO 27001, and EU AI Act controls operated as designed. Without monitoring, compliance is documentation; with monitoring, compliance is provable.
What tools should I look at for AI agent monitoring in 2026?
Open-source: OpenTelemetry GenAI, Langfuse, Phoenix, OpenLLMetry. Commercial: Datadog LLM Observability, New Relic AI Monitoring, Arize, Helicone. Governance-grade: Watch Tower Agents, which combines monitoring with runtime policy enforcement and compliance evidence.
Govern your agents before they ship
See WatchTower running on your stack in a 30-minute walkthrough.
Keep reading